To indicate that a certain result is dependent on two variables we say that R = f(x,y) where
R is the dependent variable
x and y are the two independent variables and
f stands for "function".
All combination of values of (x,y) are called the domain of f. It is said that a function is increasing(decreasing) if one of its variables simultaneously increases(decreases) as the other is held constant.
The combination of x and y variables can be represented in the form of a table. From this table an algebraic formula can be derived. This is usually written in the form of R = ax + by, where a is the amount by which each additional quantity of x changes and b is the amount by which each additional quantity of y changes. We can then also say that R = f (x,y) or f (a,b).
A way to investigate functions of two variables/ quantities dependent on two variables, one cab vary one variable over a period of time while keeping the other constant and vice versa. The change in one variable compared to the other can easily be graphed and hence interpreted in a way in which one can understand the effect of a variable more clearly as the other remains constant.
SECTION 9.2: Contour Diagrams
Functions of two variables can also be expressed as diagrams known as contours or level curves/ level sets. Such diagrams are put to use in everyday situations while deciphering weather conditions through isotherms and by studying topographical maps depicting mountains, valleys, ridges etc.
For the latter, closer lines imply mountain regions while the ones further apart usually refer to plains. The elevation numbers on the contours are important because they represent the curves of the mountains themselves. In general, contours marked in constant intervals and spaced closely together usually depict steeper terrain.
The one important point to keep in mind is that contours can never intersect.
Contour diagrams function in exactly the same way as other algebraic two variable functions. The values through the x and y values from contours can also be depicted in the form of a table if required to do so.
Cobb-Douglas Production Functions:
These are often used by businesses to estimate how revenue can be maximized through various production possibility levels (for example, whether they should initiate growth by increase number of laborers or number of machines). The graph usually looks as following:
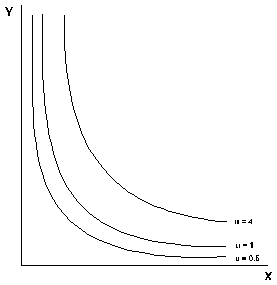
The function is written as P = f (N,V) = c(N^alpha)(V^beta) where,
P is the total quantity produced,
and c, alpha and beta are positive constants (alpha and beta lie between 0 and 1)
I had difficulty understanding why the production model has the shape it does... in fact I'm still not exactly sure why that is.
It is evident that the Cobb-Douglas Production Function is relevant to Economics Majors because it helps businessmen anticipate the results of their decisions by weighing the opportunity costs of making one decision over another.

No comments:
Post a Comment